Act V — What This Looks Like in Practice
Recent results from a NorthEra engagement
Same methodology. Same standards. Different client, similar category — services business in a competitive market. Here's what happened.
Performance
100
Perfect Lighthouse — All Categories
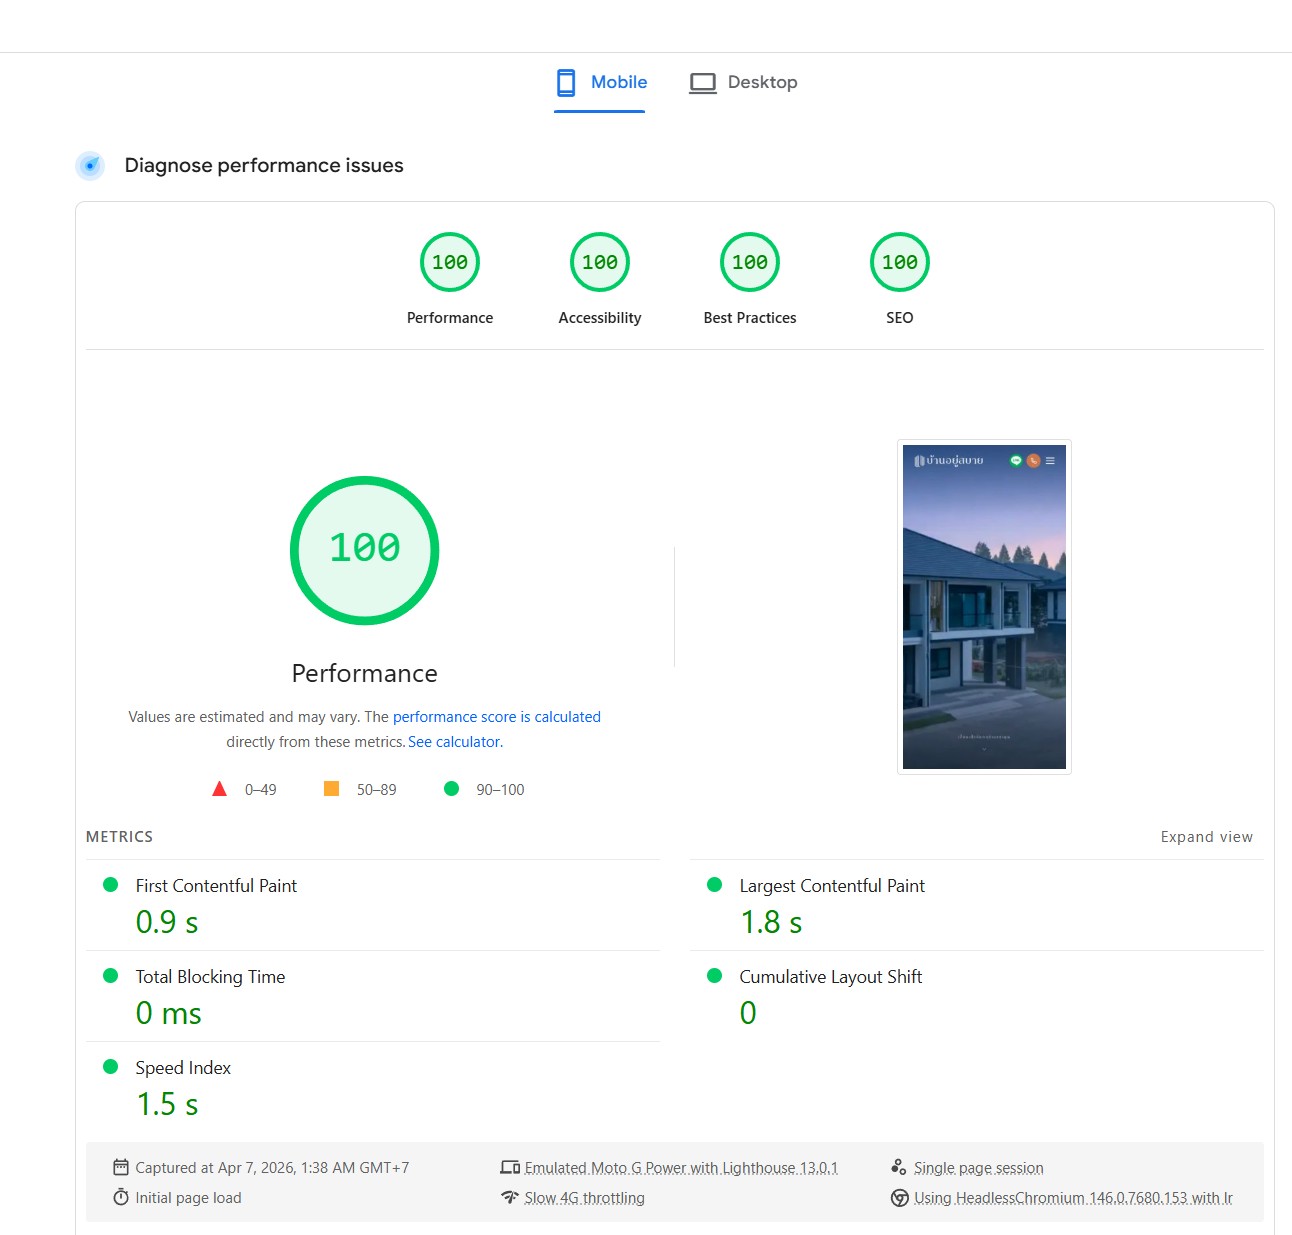
All four Lighthouse categories at 100/100 on mobile with slow 4G throttling. FCP 0.9s. LCP 1.8s. Zero blocking time. Zero layout shift.
AI Visibility
15x
AI Citations — Overnight
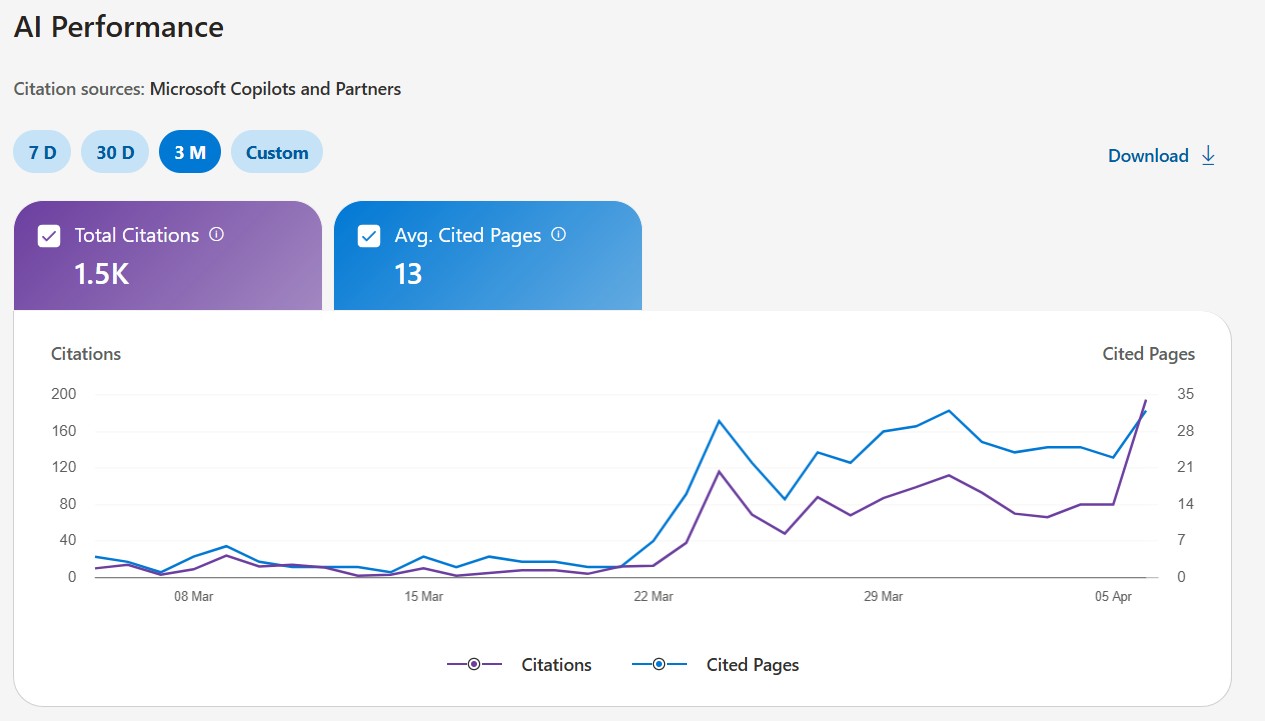
Microsoft Copilot citations — from near-zero to 1,500+ total. 15x overnight spike when GEO optimizations went live. Growth still accelerating.
Search Traffic
3x
Impressions — Overnight
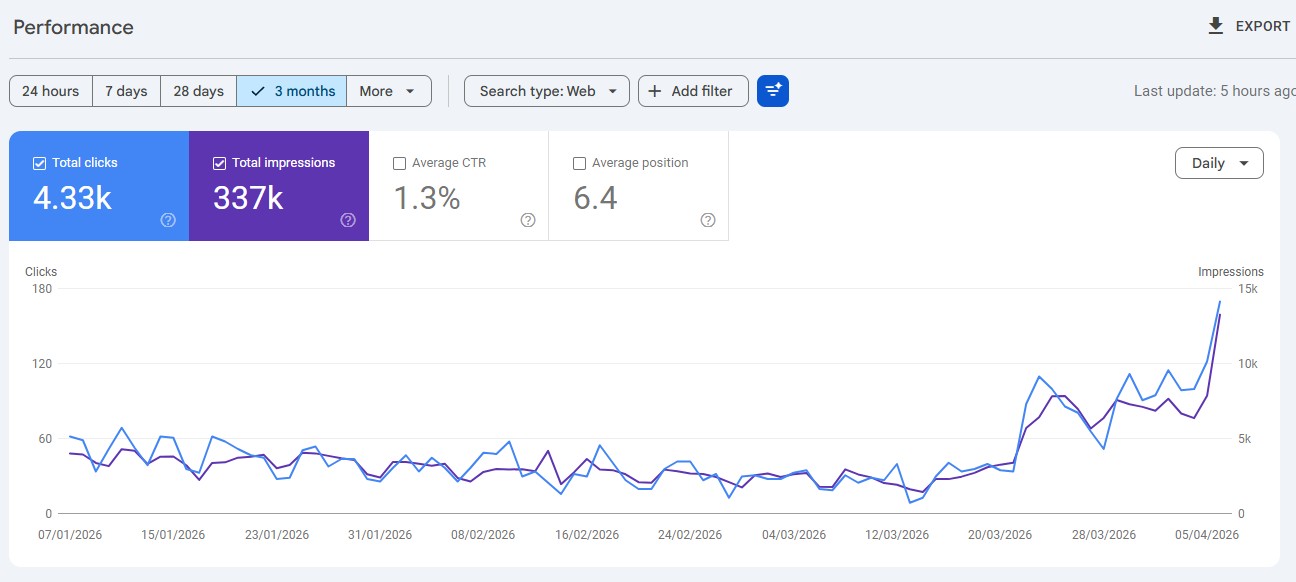
Google Search Console — 3K/day to 15K/day impressions overnight. 337K total impressions. 4.3K clicks. Average position 6.4. Hockey stick still climbing.
Same methodology. Same standards. Applied to your brand.